AI Features — Multi-Cluster Kubernetes Operations Powered by AI
KubeStellar Console uses AI Missions to automate multi-cluster Kubernetes operations. Think of it as having an expert Kubernetes engineer who knows every CNCF project and can troubleshoot, deploy, and repair across your entire fleet — saving you time and tokens.
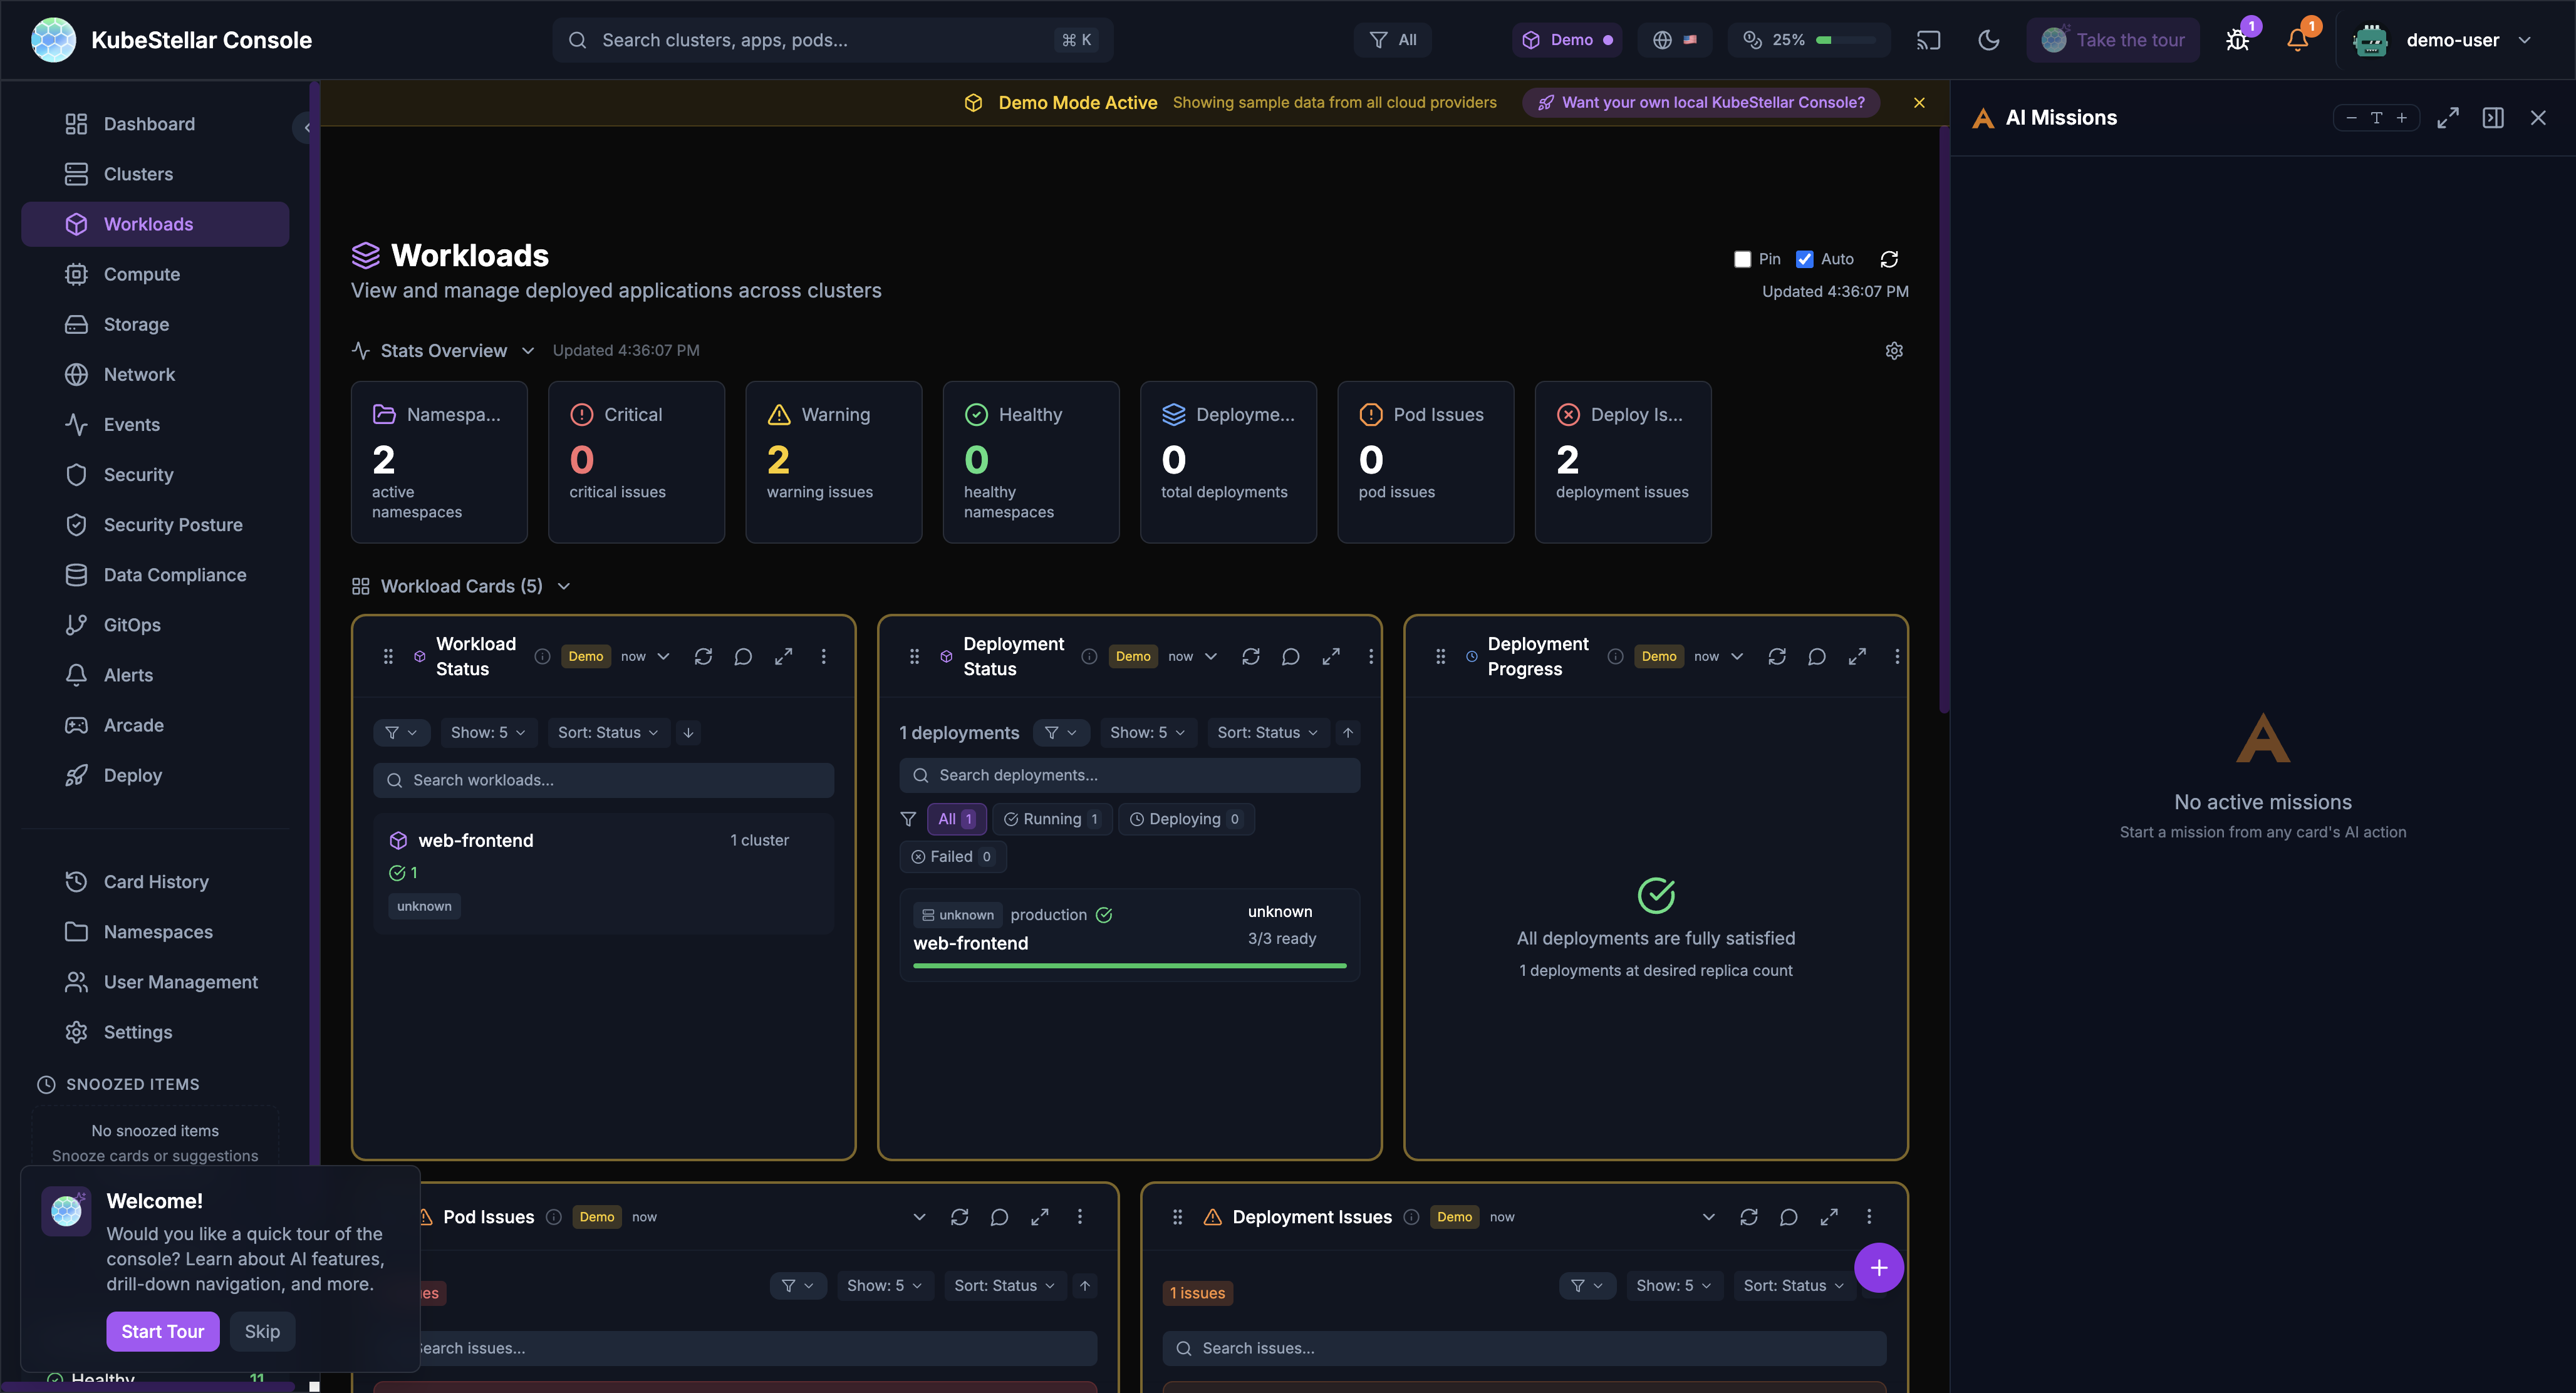
AI Missions
AI Missions are conversations with AI to solve problems. Click the mission button in the bottom right to start.
What Can You Do?
| Mission Type | What it does |
|---|---|
| Troubleshoot | Find out why something is broken |
| Analyze | Understand what’s happening |
| Repair | Fix problems automatically |
| Upgrade | Plan and execute upgrades |
| Deploy | Help deploy applications |
How It Works
- Click “AI Missions” button (bottom right)
- Choose a mission type or describe your problem
- AI asks questions to understand the issue
- AI runs commands and analyzes results
- AI suggests fixes or takes action
- You approve or reject the suggestions
Example: Troubleshooting a Crash
You: “Why is my nginx pod crashing?”
AI: “Let me check. I found the pod nginx-abc123 in namespace default is in CrashLoopBackOff. Looking at the logs…
The container is failing because it can’t bind to port 80. There’s already a process using that port.
Suggestion: Change the container port to 8080 or remove the conflicting service.”
Mission Panel Features
- Full screen - Expand for more space
- Minimize - Hide while AI works
- Collapse - Show just the title
- Multiple missions - Run several at
- Token tracking - See how many tokens used
AI Diagnose
Every card has an “Ask AI” button. Click it to get AI analysis of that specific data.
How to Use
- Look at any card
- Click the AI icon (brain/sparkle)
- AI analyzes the card data
- Get insights and suggestions
What AI Can Tell You
- Why metrics look unusual
- What’s causing issues
- How to fix problems
- What to watch out for
- Historical context
Example
Card: Cluster Health showing 2 clusters offline
AI: “I see 2 clusters are offline. Let me check…
cluster-1: Network timeout - likely a firewall issuecluster-2: Certificate expired 2 hours ago
Suggestions:
- Check VPN connection for cluster-1
- Renew certificate for cluster-2 with
kubectl certificate approve”
AI Repair
When AI diagnoses a problem, it can often fix it automatically.
How Repair Works
- AI identifies the problem
- AI creates a fix
- You review the fix
- You approve or reject
- AI applies the fix
Safety First
- AI always asks before making changes
- You see exactly what will change
- You can reject any action
- Changes are logged
What AI Can Repair
- Pod issues - Restart stuck pods, fix resource limits
- Certificate problems - Approve pending certificates
- Configuration errors - Fix ConfigMaps and Secrets
- Scaling issues - Adjust replica counts
- Resource quotas - Suggest adjustments
Custom AI Missions
You can create your own AI missions to investigate any problem or perform any task.
Starting a Custom Mission
- Click “AI Missions” button (bottom right)
- Click “Start Custom Mission”
- Type your question or task in plain English
- Press Cmd+Enter to submit
Example Custom Missions
- “Find pods with high memory usage and suggest optimization”
- “Check why my deployment is failing on cluster-2”
- “Analyze network policies across all namespaces”
- “Help me set up GPU reservations for my ML team”
Search-Based Missions
You can also start missions from the global search bar:
- Press Cmd/Ctrl + K to open search
- Type your question
- Select “Start AI Mission” from the results
Resolution History
AI missions automatically save their problem/solution pairs so you can reuse them later. This saves tokens and time by avoiding repeated analysis of the same issues.
How It Works
- When an AI mission diagnoses and resolves a problem, the resolution is saved
- The resolution includes the problem description, root cause, and solution steps
- Future missions can reference past resolutions for similar issues
Viewing Resolution History
- Navigate to the Deploy dashboard to see Deployment Missions with resolution status
- Each resolution shows whether it’s been applied (“In Orbit” for deployed fixes)
- Click any resolution to see the full problem/solution details
Resolution Tabs
Resolutions are organized by status:
- All - Every resolution recorded
- Applied - Fixes that were successfully deployed
- Pending - Suggested fixes awaiting approval
- Archived - Past resolutions for reference
Sharing Resolutions
Resolutions are stored with the console and available to all users, enabling team knowledge sharing. When a team member solves a problem, the solution is available for everyone.
Predictive Failure Detection
AI-powered prediction system that detects potential node and GPU failures before they happen.

How It Works
- AI continuously analyzes cluster health data (CPU, memory, disk, network patterns)
- Detects anomalous patterns that correlate with past failures
- Generates predictions with confidence levels
- Alerts you before failures occur
Configuration
Configure in Settings > AI & Intelligence > Predictions:
- AI Predictions - Toggle prediction analysis on/off
- Analysis Interval - How often to run (15 min to 2 hours, default 30 min)
- Minimum Confidence - Threshold for showing predictions (50% to 90%, default 60%)
- Multi-Provider Consensus - Run analysis on multiple AI providers for higher confidence
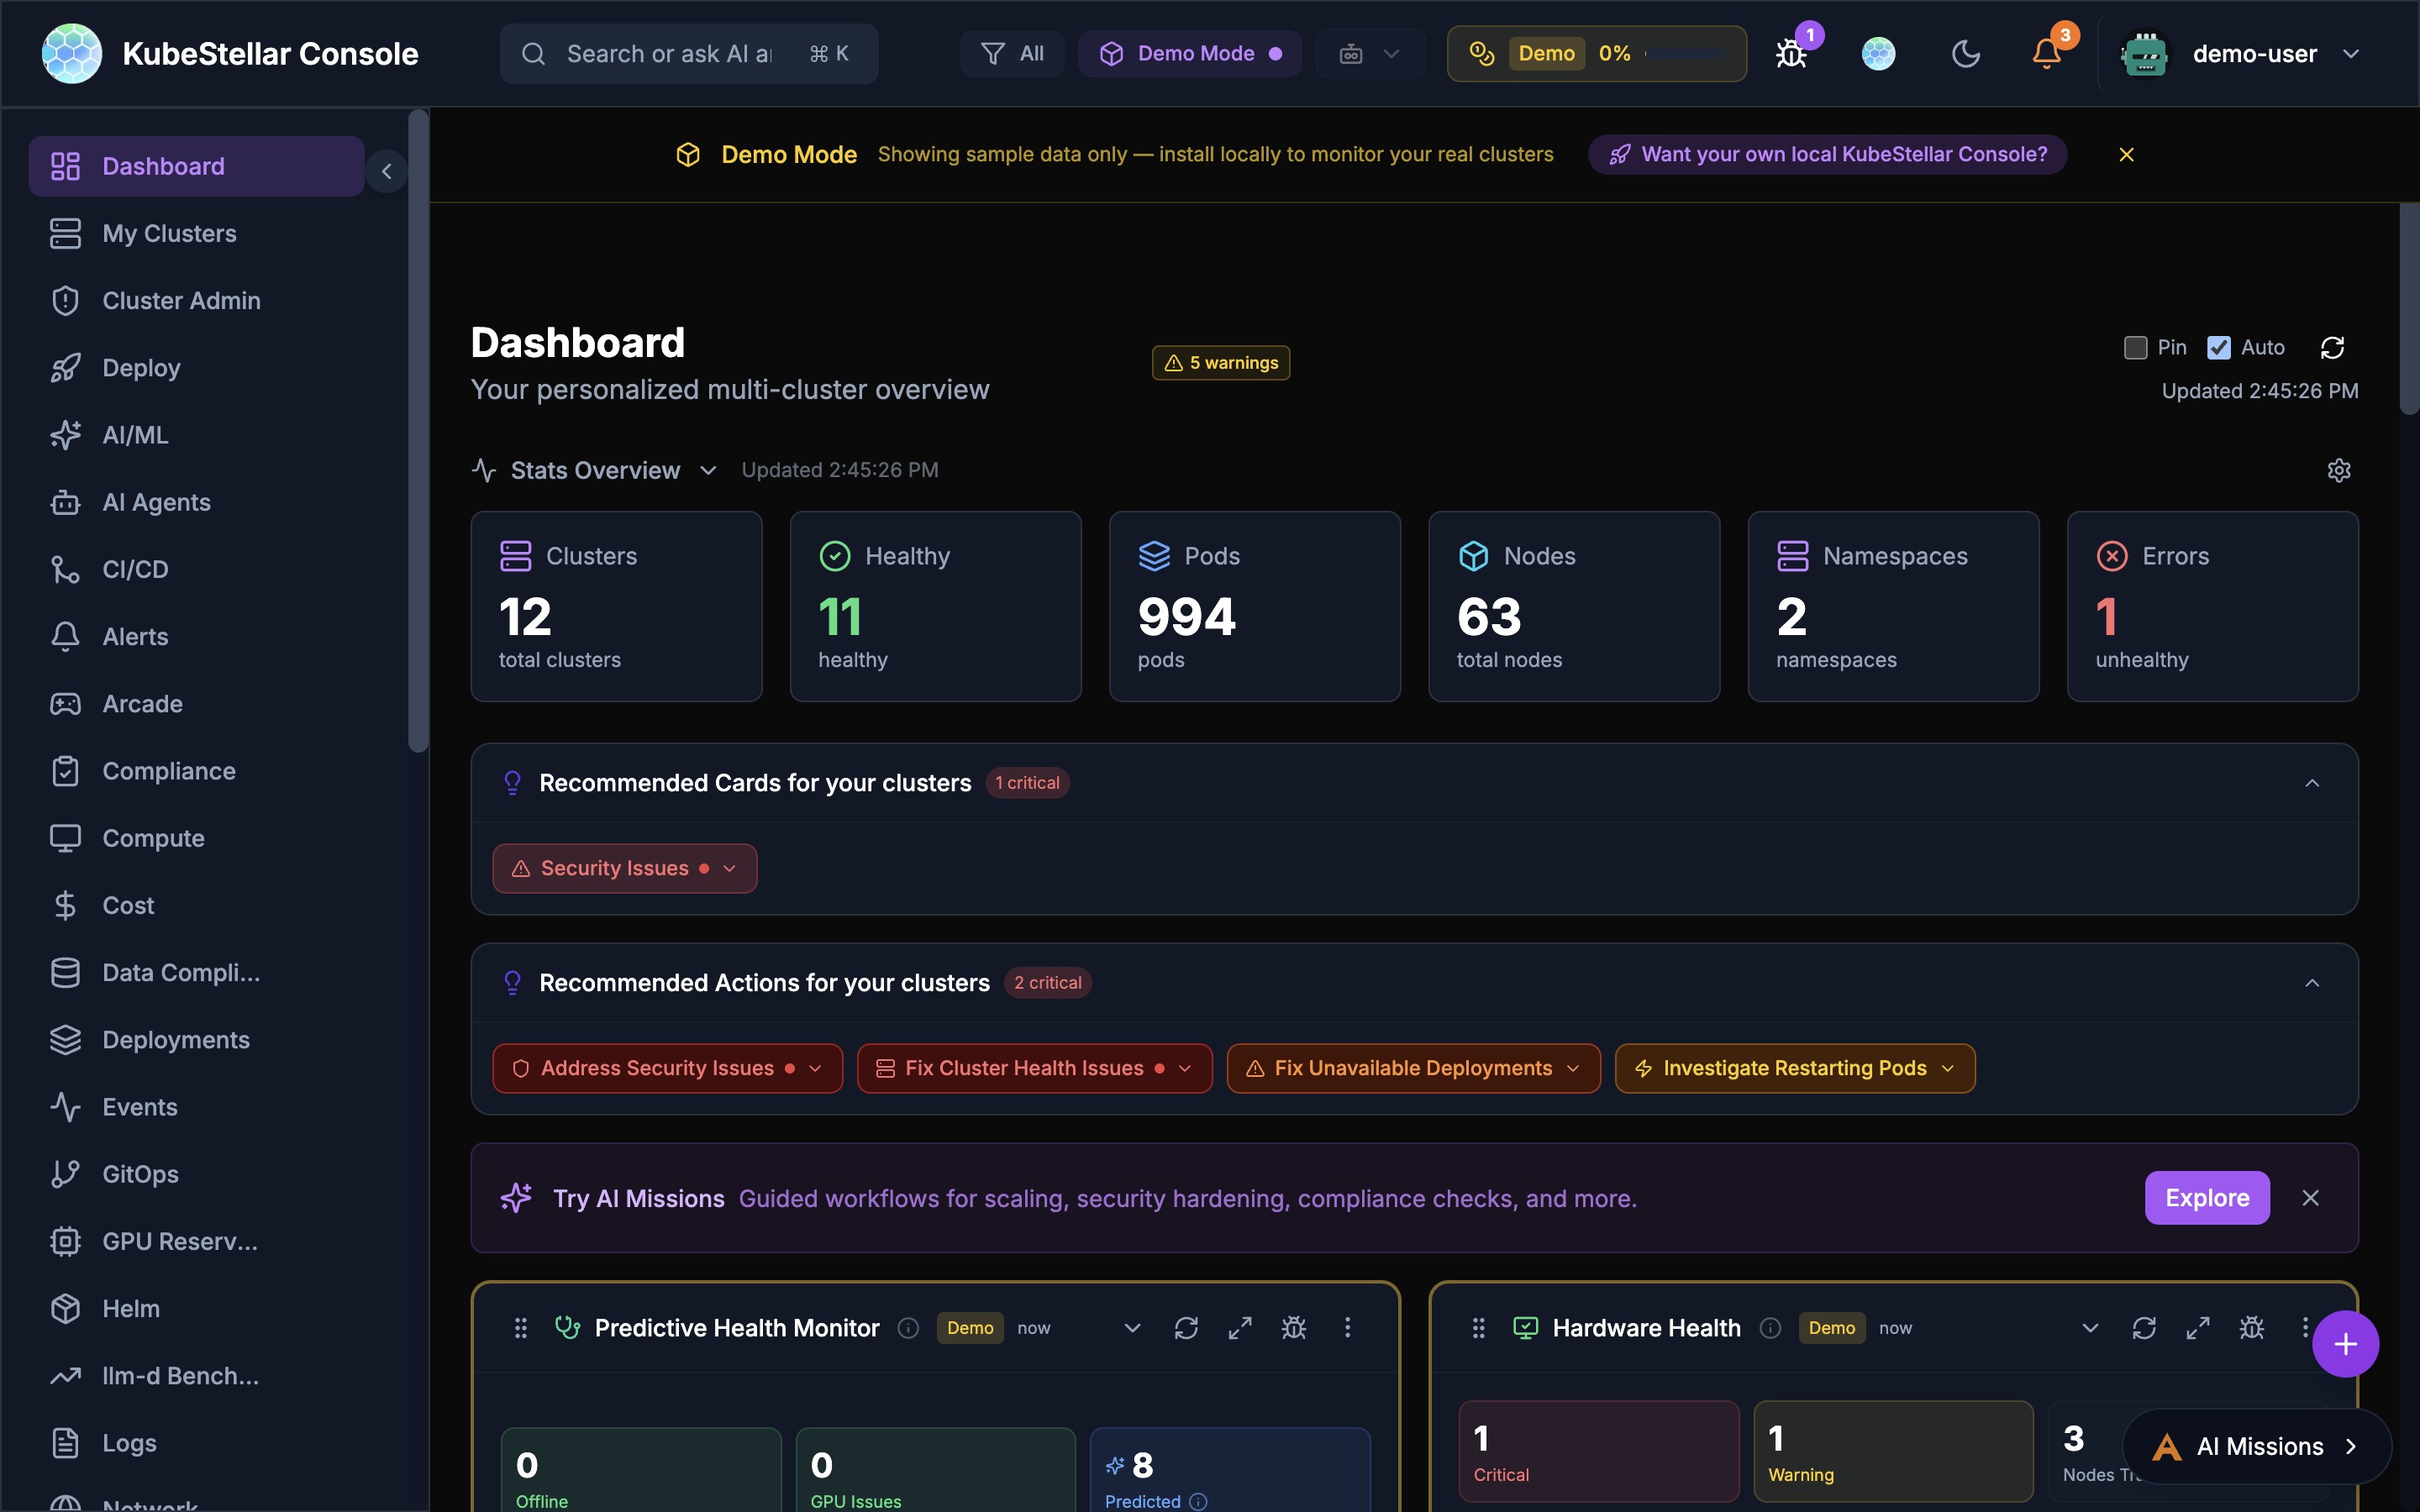
Prediction Cards
The Predictive Health Monitor card on the Clusters dashboard shows:
- Offline count - Currently offline nodes
- GPU Issues count - GPU nodes with problems
- Predicted count - Nodes predicted to have issues soon
- Issue list with severity, confidence, cluster, and correlated patterns
Root Cause Analysis (RCA)
When the AI detects an issue or predicts a failure, it provides root cause analysis:
- Pattern correlation - Links symptoms to likely causes (e.g., “restart pattern detected - crashes correlate with traffic spikes”)
- Resource trending - “Memory usage trending upward, may hit limits in ~2 hours”
- Historical comparison - Compares current patterns to past incidents
Heuristic Thresholds
Fine-tune detection sensitivity with heuristic thresholds for:
- Memory pressure
- CPU saturation
- Disk I/O anomalies
- Network connectivity patterns
- Pod restart frequency
Smart Suggestions
AI watches how you use the console and suggests improvements.
Card Swap Suggestions
When AI notices you’re focusing on different things:
- AI detects focus change
- Shows a suggestion with countdown
- You can:
- Accept - Swap to the new card
- Snooze - Hide for 1 hour
- Keep - Stay with current card
- Cancel - Dismiss suggestion
What Triggers Suggestions?
- Spending time on a specific card
- Clicking into details repeatedly
- Issues appearing in your clusters
- Changes in cluster state
Example
You’ve been looking at pod issues for 5 minutes
AI Suggestion: “I notice you’re focused on pod issues. Would you like to swap the Cluster Metrics card for a Pod Health Trend card?”
AI Card Creation
You can create brand new cards just by describing what you want. This is the Card Factory feature.
How to Create a Card with AI
- Open the Card Factory (from the add card menu)
- Choose “Describe with AI”
- Type what you want in plain English
- AI builds the card
- Preview it and add to your dashboard
Example
You type: “Show me a card that displays the top 5 pods by memory usage with a bar chart”
AI creates: A custom bar chart card showing your top pods ranked by memory, updating in real time.
What You Can Create
- Custom metric views for your specific needs
- Charts and tables with your own filters
- Cards that combine data from multiple sources
- Specialized views for your team’s workflow
Other Ways to Create Cards
If you prefer code, the Card Factory also accepts:
- JSON definitions - Declarative card configuration
- TSX code - Full React components (compiled at runtime)
Provider Health Monitoring
The Provider Health card shows you the status of AI services and cloud providers your console depends on.
What It Shows
- Claude (Anthropic) - Status and availability
- OpenAI - Status and availability
- Gemini (Google) - Status and availability
- Cloud providers - AWS, Azure, GCP status
Why It Matters
If AI features stop working or respond slowly, check the Provider Health card first. It tells you whether the issue is on your side or the provider’s side.
AI Mode Levels
Control how much AI assistance you get:
Low Mode (~10% tokens)
- AI responds when you ask
- Direct kubectl commands
- Best for: Cost control
Medium Mode (~50% tokens)
- AI analyzes on request
- Summaries and insights
- Best for: Balanced usage
High Mode (~100% tokens)
- Proactive suggestions
- Auto-analysis of issues
- Card swap recommendations
- Best for: Maximum assistance
Changing AI Mode
- Go to Settings (
/settings) - Find “AI Mode”
- Select your preferred level
- Changes apply immediately
Token Usage
AI features use tokens, which may have costs. The console tracks usage.
Viewing Token Usage
- Header bar - Shows percentage used
- Settings page - Detailed breakdown
- Mission panel - Per-mission tracking
Token Limits
You can set limits to control costs:
ai:
  tokenLimits:
    enabled: true
    monthlyLimit: 100000
    warningThreshold: 80   # Warn at 80%
    criticalThreshold: 95  # Restrict at 95%
When you hit the warning threshold, you’ll see a notification. At the critical threshold, some AI features are restricted.
Tips for Saving Tokens
- Use Low or Medium mode for routine work
- Switch to High mode when troubleshooting
- Use direct kubectl for simple queries
- Review mission history to avoid duplicates
Privacy & Safety
What AI Sees
- Cluster names and namespaces
- Pod and deployment names
- Resource metrics
- Event messages
- Log snippets (when you share them)
What AI Doesn’t See
- Your kubeconfig credentials
- Secrets or sensitive data
- Personal information
- Data from other users
Data Handling
- AI analysis happens through Anthropic’s API
- According to Anthropic’s data usage policy, data sent via their API is not used to train Anthropic models by default. For details, see Anthropic’s privacy and data usage documentation.
- Conversations are stored locally
- You can delete mission history anytime
Mission Sharing & Security Scanning (New in March 2026)
AI missions can now be shared with team members and the community, with automatic security scanning.
Sharing Missions
- Generate share link: Click the share icon on any mission to create a shareable URL
- Embedded configuration: Share links include the mission configuration, target clusters, and parameters
- Deep-link support: Share links preserve query parameters through OAuth login flows
- Import from link: Recipients can import shared missions with click
Security Scanning
When importing missions from external sources:
- Missions are scanned for potentially dangerous operations (e.g.,
kubectl delete, privilege escalation) - Security scan results are displayed before import with severity ratings
- Users must acknowledge security findings before proceeding
- Scans check for: resource deletion, RBAC escalation, host path mounts, privileged containers
AI Agent On/Off Toggle (New in March 2026)
The AI Agent system now includes fine-grained control over agent activation:
Toggle Control
- On: Agent is active and processing cluster data
- Off: Agent is paused but retains its memory and configuration
- None: All agents disabled with a clean dashboard view
Agent Memory
- Agents now maintain persistent memory across sessions
- Memory includes past diagnoses, resolutions, and cluster-specific context
- Memory is used to improve future responses and avoid repeated analysis
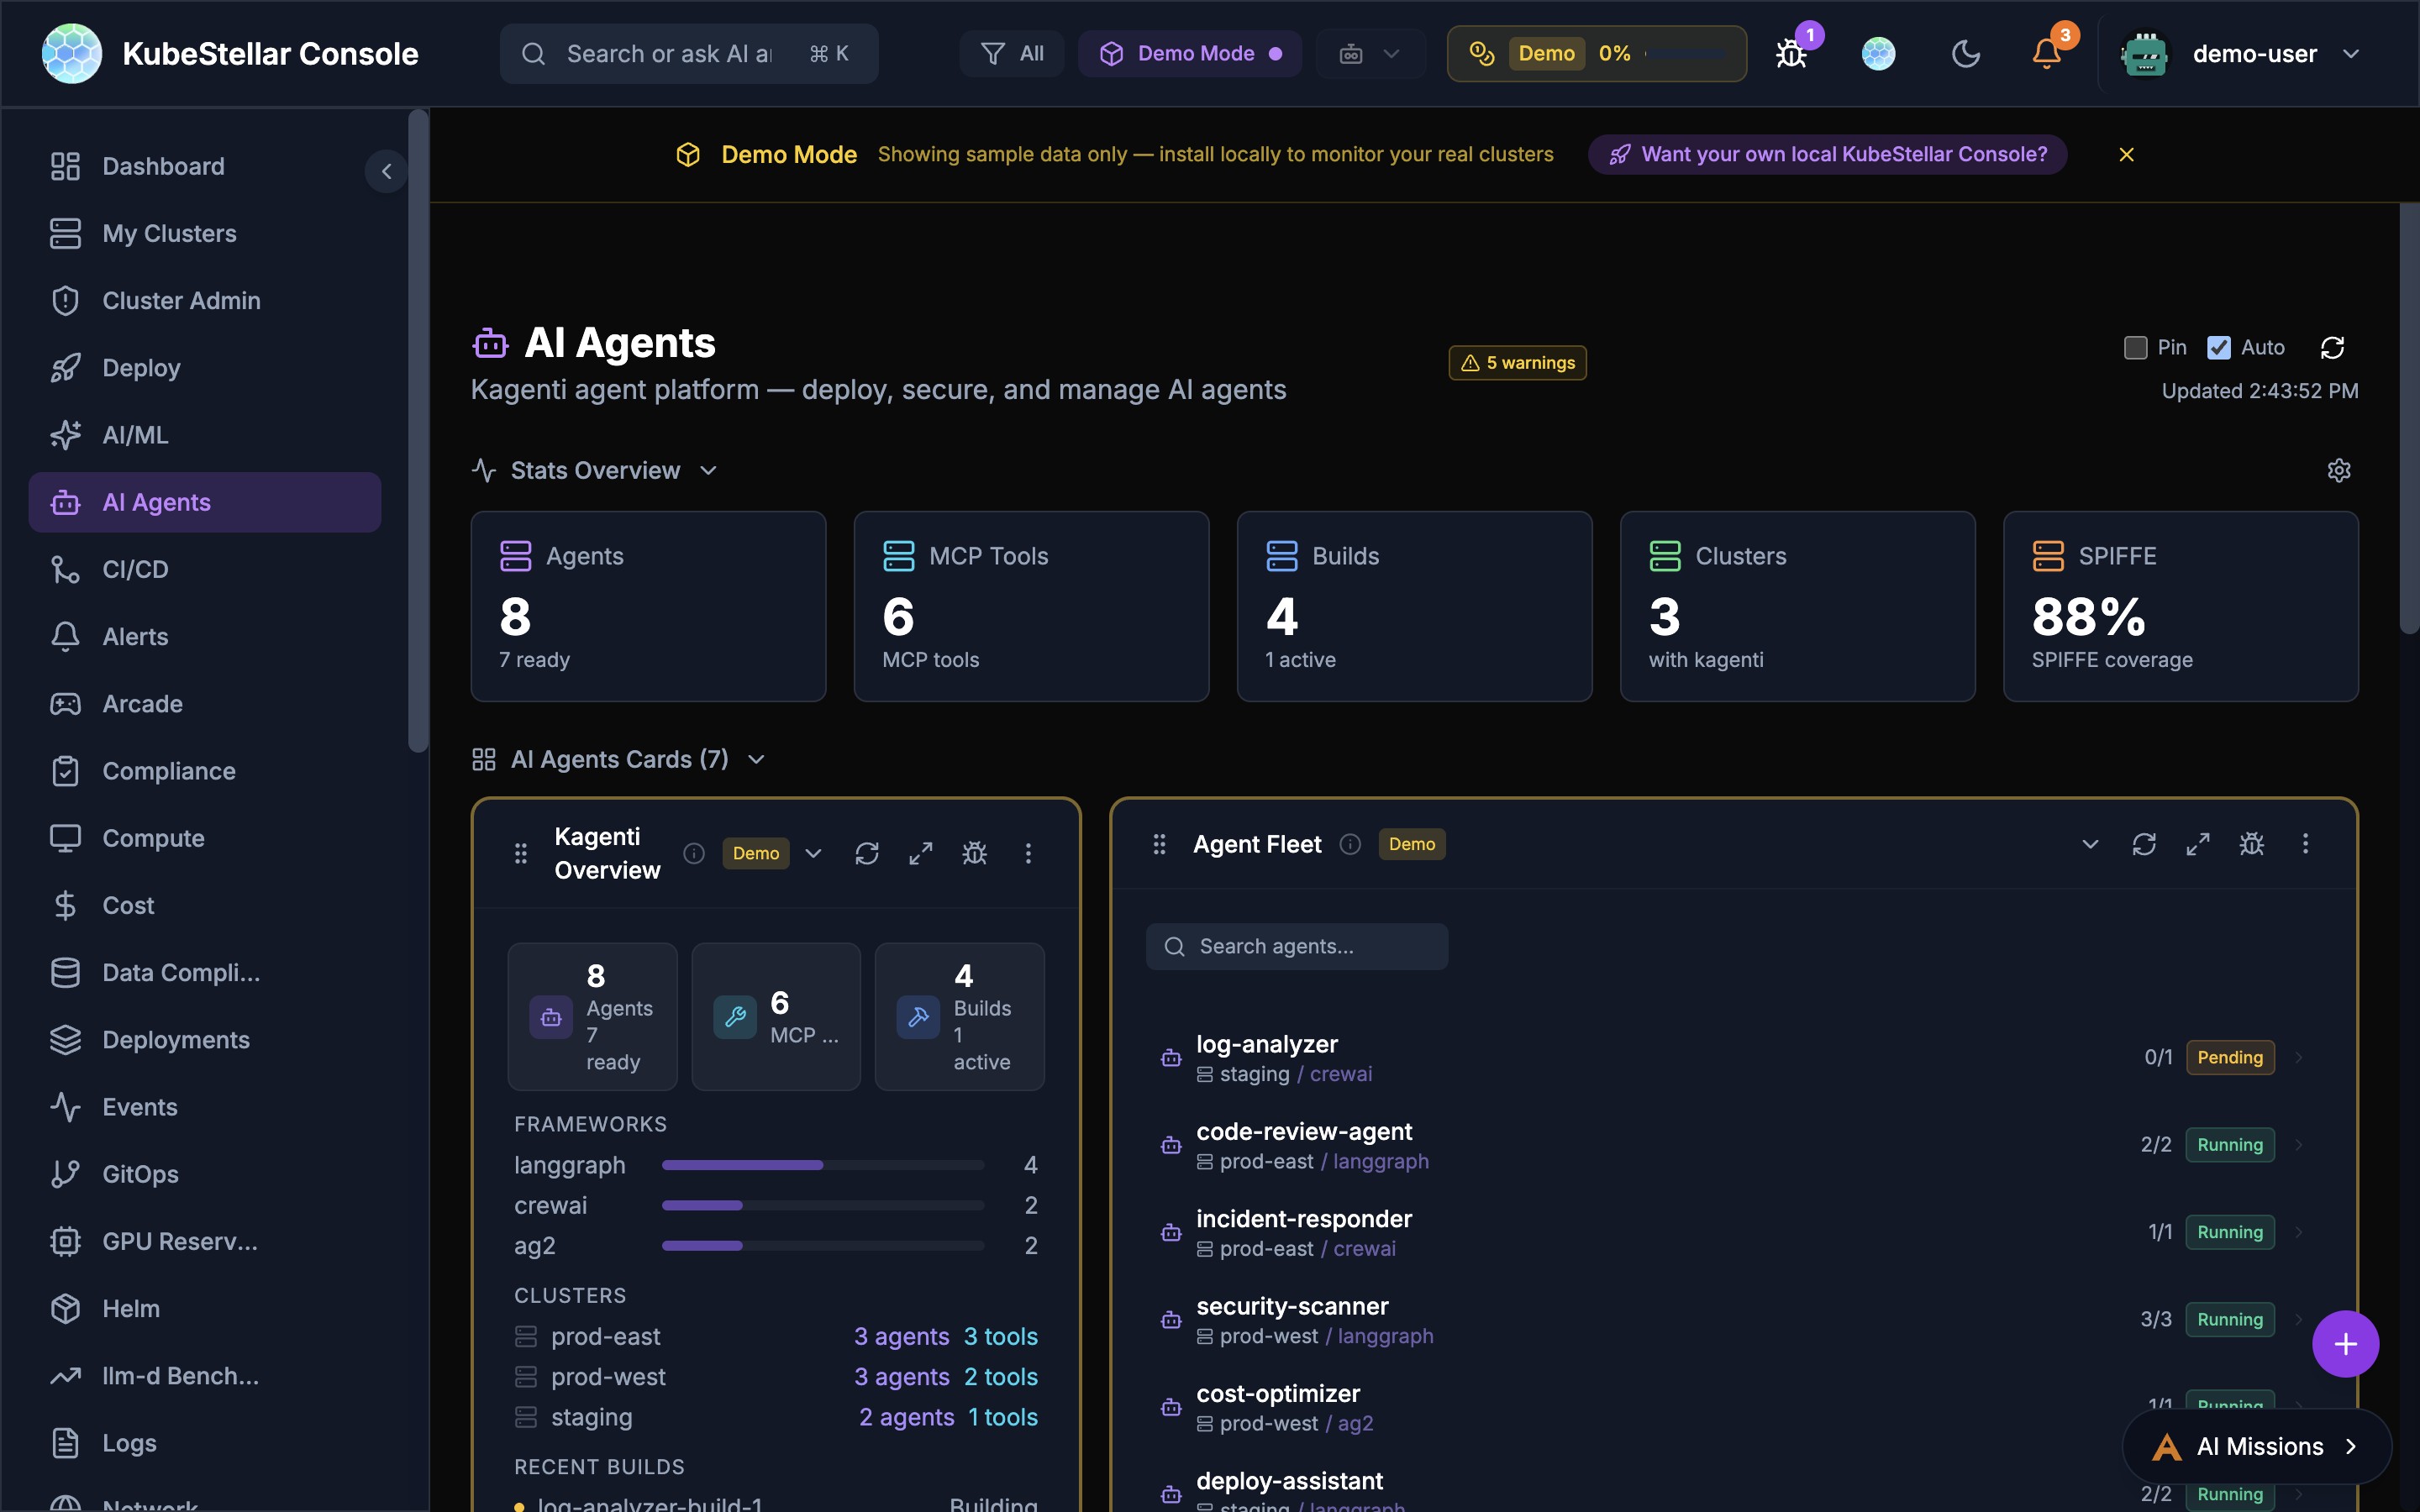
- Memory can be cleared per-agent from the Agent Fleet card
Live Indicator
- A “Live” badge appears next to active agents in the header
- The badge pulses when the agent is actively processing a request
- Click the badge to jump to the AI Agents dashboard